Mathematics
Advanced
50 mins
Teacher/Student led
+80 XP
Teacher-led from the board — pupils need no device

Scale Drawings and Scale Maps: Small Drawings of Big Things
Learn how scale ratios link tiny drawings to real-world sizes. Convert between paper lengths and actual measurements using scales like 1:100, then sketch plans of real objects and spaces.
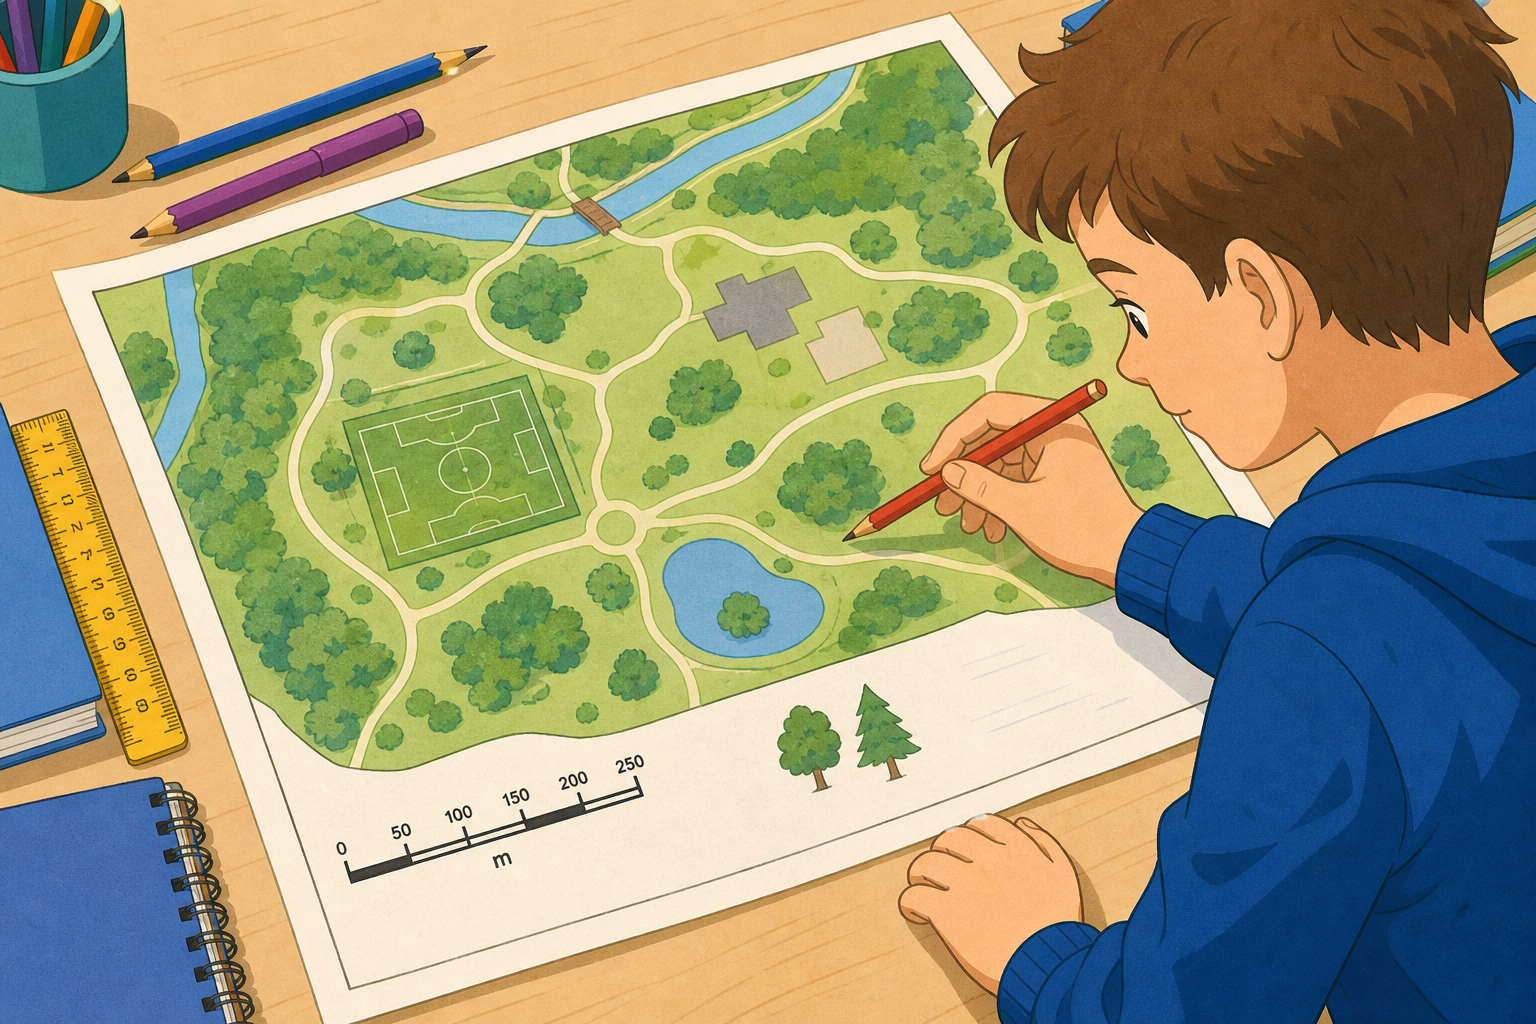 Look at this map of a local park. Down in the corner there is a little scale bar. A scale bar is a small ruler-like marker on a map that shows how much real distance a short paper length stands for. Two trees are drawn close together on the paper, but in real life they might be far apart. How could that tiny scale bar tell us the real distance between the two trees without ever walking it?
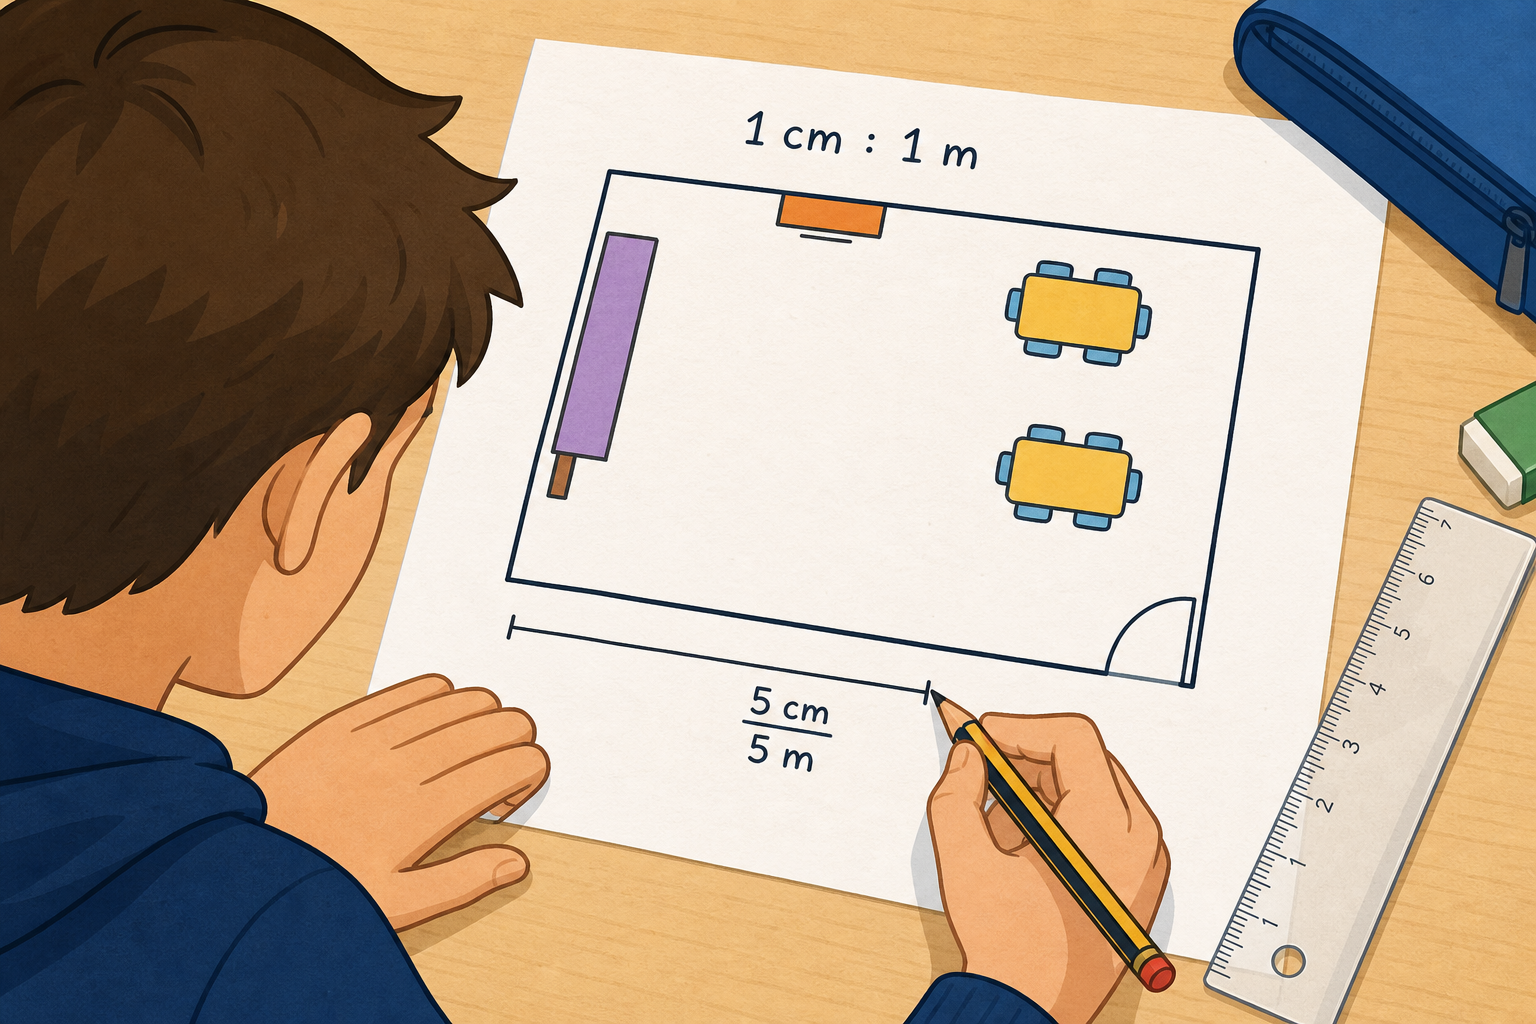 Look at this classroom plan. It shows paper lengths and the scale above it. The same rule turns each paper length into a real distance.