Here are two questions. How tall am I? and How tall is everyone in our class?
One of these is worth surveying the whole class about. The other you could answer with a single measurement. Which is which, and what makes a question worth asking lots of people?
Take three hands-up answers, not open call-outs. Give five seconds of quiet think-time first.
Listen for the idea that How tall am I? has one answer, while How tall is everyone? gives a whole spread of different heights. Don't name the term statistical question yet, that lands in the next step.
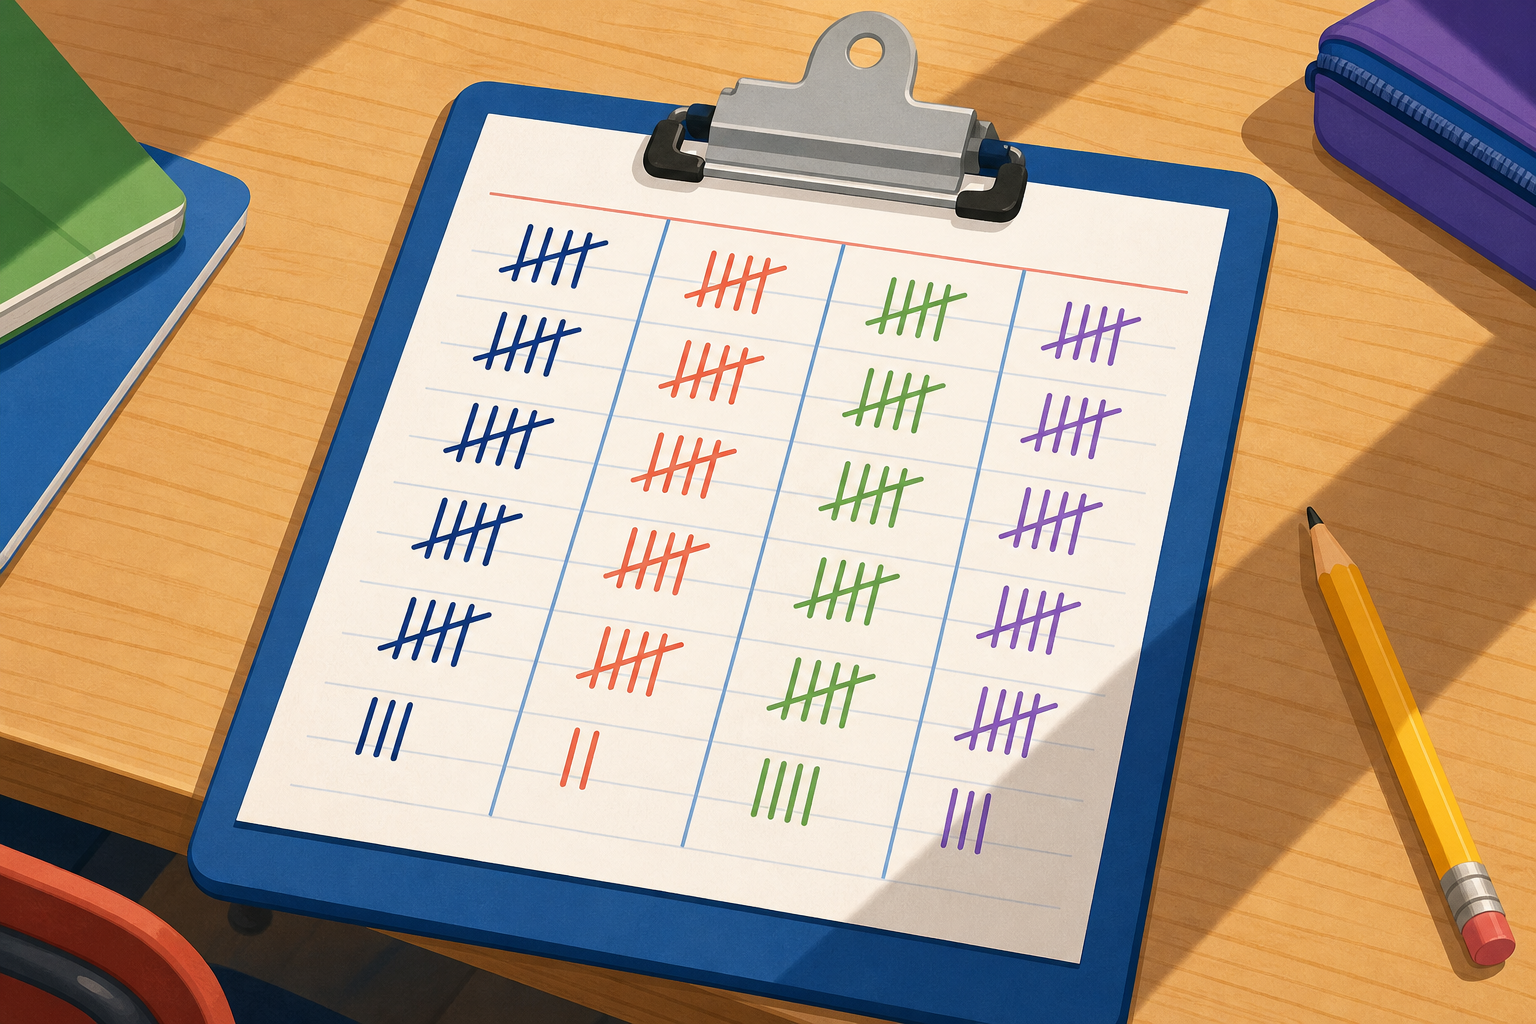
Let's sort some questions together. A statistical question is one that expects lots of different answers when you ask a group of people. A question with just one fixed answer is not worth surveying.
Look at each of these four and decide: would the answers vary from person to person, or would everyone give the same answer?
Walk each question aloud, one at a time.
Key line to say aloud: if the answers vary, it is worth surveying; if they don't, it isn't.
Let's try this in your groups. Draft one statistical question you could survey the class with, then agree what kind of answers you'd expect to get back, and whether they'd really vary.
Write your draft on your group's paper first. Then we'll share each group's question at the board and refine the wording together so it is clear and gives a good spread of answers.
This round is for talking it through together. While groups draft, each group writes its one question on its own sheet of paper or in a copybook — not at the board yet. When you call for share-back, one nominated pupil from each group brings their draft to the board so the class can see and refine it one at a time.
Move around the groups as they draft. Push them away from yes/no questions (Do you like football?) toward open ones that give a spread (What is your favourite sport? or How many matches do you watch in a week?).
When sharing back, ask the class for each draft: would the answers vary, or would most people say the same thing? Revoice a strong refinement: so changing 'do you like' to 'how many' gives us a much wider range of answers. At the very end, agree one class question and write it at the top of the board, where it stays for the survey step.
In your maths copy, write three statistical questions you could survey the class with. Beside each one, note what kind of answers you would expect to get back.
For example, beside What is your favourite sport? you might write a spread of sport names; beside How many minutes do you read at home? you might write a range of numbers.
Walk the room glancing at whether each question would really give varied answers — this is whole-class copybook practice, not marking. If you spot a yes/no question, quietly prompt the pupil to reword it.
Now let's run our agreed class question together. Our class question is the one we agreed on at the end of the discussion, written at the top of the board now.
Each of you writes your answer on a response card. As the cards come up, the recorder reads them out and writes each one into a list on the board, in the order they are read. This complete, unsorted list is our raw data: every answer written exactly as given, before any sorting or counting.
We'll gather answers row by row, so we may only get through part of the class today — that's fine. Watch for any response that doesn't actually fit the question, and if you spot one, explain why it doesn't belong.
Hand a response card to each pupil. They write their answer to the agreed class question on it.
Have one pupil at the board record each card's answer as it is read out, building the raw data list. Rotate the recorder every few responses.
What did you notice about our survey? Did our question give a good spread of answers, or did most people say the same thing? If we asked a vague question, what kind of mess might we end up with in our list?
Listen for pupils naming the link between a clear question and tidy data. Revoice a strong answer: so a fuzzy question lets people answer in different ways, and then our list is hard to make sense of.
If the class question gave a good spread, point that out as the mark of a strong statistical question.
Next we take a raw list like the one we built today and start to organise it — sorting wide-spread values into equal groups so the mess becomes a tidy table.
Keep the closing brisk. The raw list built today is the natural starting point for the grouped frequency table in the next lesson.
You're previewing this lesson. Get full access to this lesson and hundreds more — each one ready to teach, with interactive activities, printable resources and pupil progress tracking built in.