Mathematics
Advanced
50 mins
Teacher/Student led
+80 XP
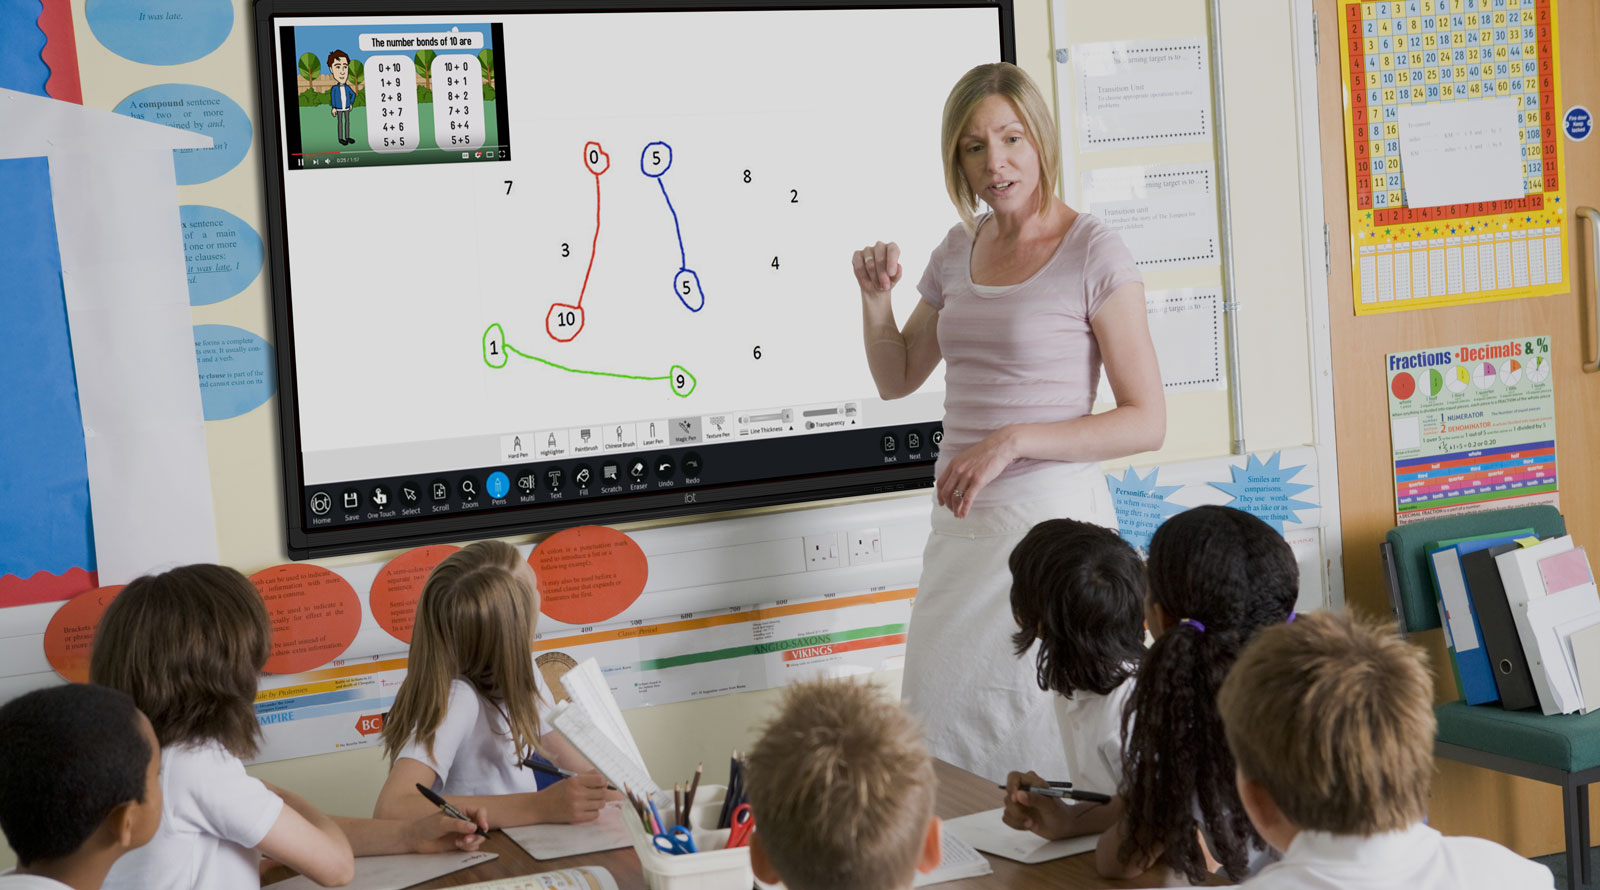
Teacher-led from the board. Pupils do not need a device, but can follow on one.
What you need:
IWB/Projector/Large Screen

Critically Evaluating Graphs and Misleading Data

Learn to spot three ways graphs mislead: chopped axes, uneven scales, and sized-up symbols. Read the real numbers, name the trick, and redraw graphs fairly starting at zero.

Teacher Class Feed

Load previous activity
    Your turn
    Your teacher is running this lesson on the board. Here is the part you can try yourself.

    1 - Getting Started ~4 mins

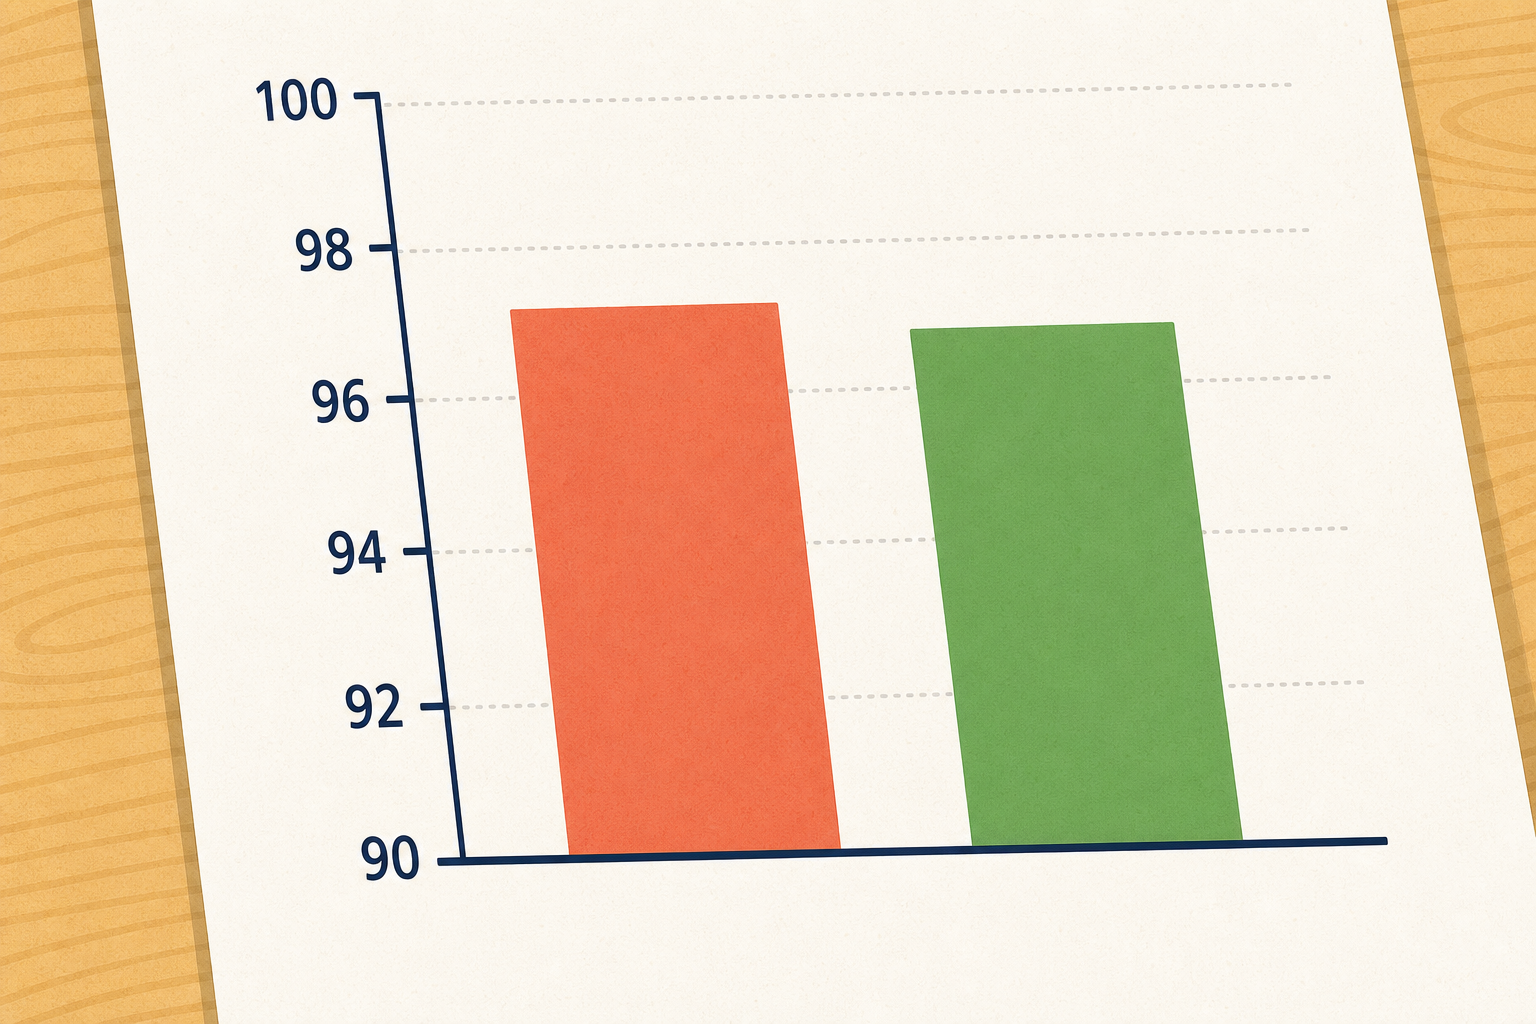
    Two bar charts side by side, each with a bar A at 92 and a bar B at 98, drawn on different scales.Here are two bar charts side by side, both showing the exact same two numbers. In one, the scale starts at zero and the two bars look almost the same height. In the other, the scale starts at 90 and one bar towers over the other. Same numbers, two completely different stories. How can both charts be honest?
    2 - Watch and Notice ~12 mins

    Illustration for Watch and NoticeWe will walk through three graphs that each bend the truth in a different way. Listen for the real numbers on each one, then look at the picture the graph paints. Watch for where the picture and the numbers disagree.
    Trick 1: The chopped axis

    Trick 2: The uneven scale

    The last one uses no scale at all. It uses pictures of different sizes.

    Trick 3: The sized-up pictogram

    3 - Try It Together ~12 mins

    We'll work through three tricky graphs one at a time. Each bullet below gives you the real numbers. For each one, name the trick and describe what a fair version would look like.

    • A football chart: Team A has 9 wins and Team B has 12 wins, but the Team B bar looks four times taller.
    • A temperature chart with the marks 0, 5, 20, 40 up the side.
    • A pictogram of pets, one dog symbol for every 5 pets: Class 5 has 10 pets (2 symbols) and Class 6 has 15 pets (3 symbols), but Class 6's symbols look much bigger.

    Ways to start:

    • Start from the actual numbers given in each bullet, not the bar heights.
    • Ask where the vertical scale starts — is it zero, or higher?

    Stretch:

    • For each graph, describe the fair version in words: where would the scale start and what would change?
    Answers & strategies (teacher)
    1. Two football teams' wins are shown with the scale starting at 8: Team A has 9 wins, Team B has 12 wins. The Team B bar looks four times taller. What is the real difference, and what is the trick? — Real difference is 12 − 9 = 3 wins. The trick is a truncated (chopped) axis starting at 8 instead of 0, which makes a difference of 3 look like four times as tall.
    2. A temperature chart has scale marks 0, 5, 20, 40 all spaced evenly up the side. Why can you not compare the bar heights fairly? — The scale is uneven — the jumps are 5, 15, 20 but drawn the same distance apart, so equal spaces do not mean equal jumps and the bar shapes are distorted.
    3. A pictogram uses one dog symbol per 5 pets, but Class 6's symbol is drawn twice as wide and twice as tall as the others. Class 5 has 10 pets (2 symbols), Class 6 has 15 pets (3 symbols). Why does Class 6 look far more than 15? — Class 6 really has 15 pets (3 symbols). Because each symbol is twice as wide and twice as tall, it covers four times the area, so the eye reads area not count and Class 6 looks many times bigger than it should.

    4 - Redraw It Fairly in Your Copy ~3 mins

    COPYBOOK MOMENT

    Illustration for Redraw It Fairly in Your CopyPick one misleading graph from today's lesson. In your maths copy, sketch the same data drawn fairly, using a scale that starts at zero with even gaps, or equal-sized symbols. Then write one sentence naming the trick the original graph used.

    Pupil practice
    Module 9 · Data and Chance Data & Chance
    Lesson 108 · Critically Evaluating Graphs and Misleading Data
    Download Activity Book page (PDF)
    123learn · Online learning platform

    Unlock the full learning experience

    You're previewing this lesson. Get full access to this lesson and hundreds more — each one ready to teach, with interactive activities, printable resources and pupil progress tracking built in.

    Hundreds of curriculum-aligned lessons
    Interactive activities in every lesson
    Printable resources & progress tracking
    Copyright Notice
    This lesson is copyright of 123Learn.ie 2017 - 2026. Unauthorised use, copying or distribution is not allowed.
    🍪 Our website uses cookies to make your browsing experience better. By using our website you agree to our use of cookies. Learn more